All Forex Continuation and Reversal Patterns
Forex Reversal Patterns
Successful traders trade in line with the trend. They study the charts and master the art of identifying patterns in them. It helps to derive valuable information from the forex reversal patterns and continuation patterns hidden between the candles. The identification of patterns and adapting to the market movements provide successful trade results.
Patterns are unique forms or shapes which occur repeatedly and produce reliable results whenever they occur. Patterns provide clues of the impending next move or a glimpse of the future price movement most of the time. Since these patterns form repeatedly, a careful study of them produces a great understanding of the price movements. This improves the trading results of the forex trader significantly.
Patterns form an essential aspect of technical analysis and provide the basis for many technical tools and indicators. Forex patterns are classified into forex continuation patterns and forex reversal patterns. The most importantly searched and followed being the forex reversal patterns.
Forex reversal patterns provide the trader with the best exit point of a current trend. Similarly, they offer an excellent trading opportunity to enter the markets at the beginning of a new direction. On the other hand, continuation patterns provide a profitable opportunity to add more positions and scale up to maximize profits.
Candle stick charts:
Japanese rice traders used candlestick charts. They discovered that the emotions of the traders widely influenced the supply and demand of a trading instrument. Thus the emotions were considered as an essential factor that influenced the price movements. Human emotions tend to be in patterns, and the chart proved it repeatedly. Candlestick patterns provide valuable clues to those emotions and their influence on prices. The candlestick charting was introduced to the West by Steve Nison.
How to identify trend reversal in forex ?
Price tends to reverse their current direction upon the formation of these candlestick reversal patterns. As these patterns predict a reversal, their presence or absence is very closely monitored by forex traders. Many traders use the reversal patterns extensively to manage their current trades and plan new ones.
Candlestick reversal patterns provide the best possible entry points and a very reasonable stop loss. But they do not give a take profit point as the purpose of these patterns is to identify the entry points. Most forex traders use a reasonable risk and reward ratio to calculate the take profit points or use other technical indicators and tools to determine the best take profit points.
Many tools have been programmed as forex reversal pattern indicator. But its at the best interest of the trader to manually identify and understand them.
Here are the 12 important candlestick reversal patterns:
- Hammer
- Hanging Man
- Bullish Engulfing
- Bearish Engulfing
- Bearish Harami
- Bullish Harami
- Three White Soldiers
- Three Black Crows
- Morning Star Doji
- Evening star Doji
- Morning Star
- Evening Star
Candlestick Reversal Pattern – Hammer:
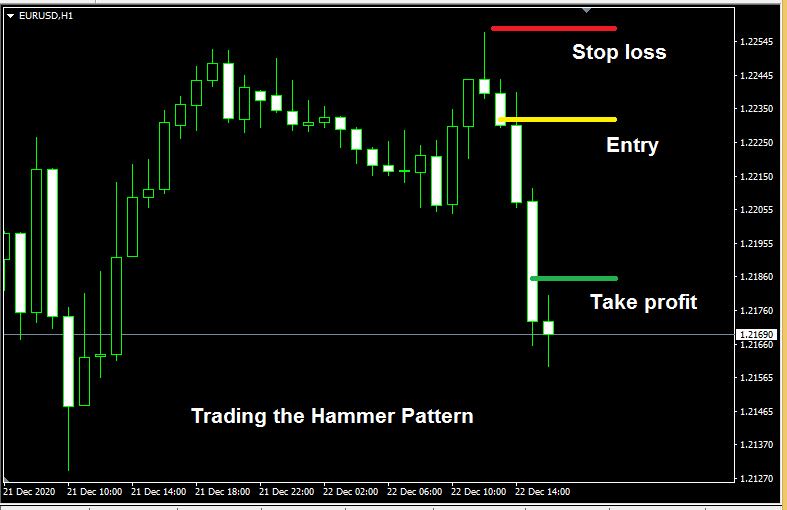
The Hammer pattern is a frequently occurring forex candlestick reversal pattern. Traders easily identify it due to its shape of a long wick and a small body. The length of the wick usually is more than thrice the length of the body of the candle.
The next candle confirms the hammer pattern. If the next candle also closes in the hammer candle's direction, then the pattern is confirmed. The candle's closing price next to the hammer provides the entry point, and the high of the hammer candle provides the best stop loss point. Hammers occur in a downtrend and signal a waning momentum of the sellers and their increasing strength.
During the downtrend, the long wick shows the sellers losing control to the buyers. A hammer formed in a flat market or during low volatile markets may not produce significant results. Most patterns formed during the US or London sessions provide the best results.
Back to top
Forex Candlestick Reversal Pattern – Hanging Man:
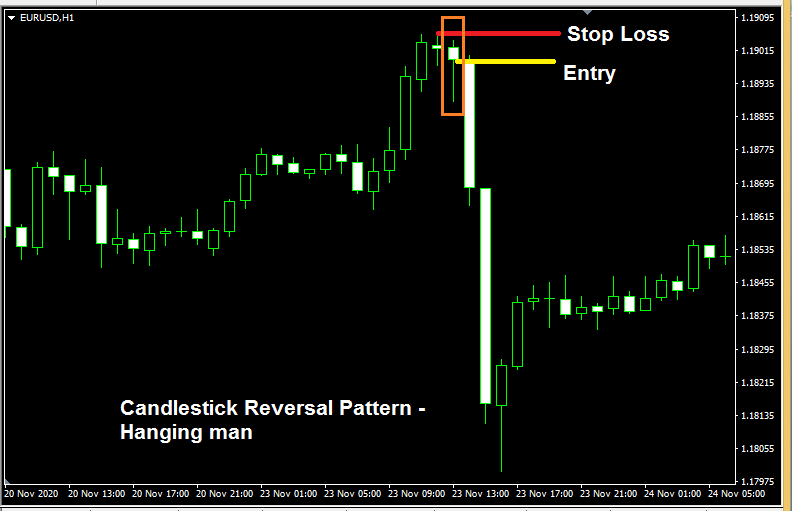
Hanging man patterns are similar to the hammer pattern. But the Hanging man pattern is formed on the uptrend. The hanging man candlestick predicts a reversal in the prices. The candle can be easily identified by the long wick and real short body. The candle's real body is at least three times less than the candle's wick's length.
During an uptrend when the buyers are in control, the long wick to the downside signifies sellers' entry into the market. The next candle confirms the Hanging man. If the prices close lower in the next candle to the Hanging man, it signifies the sellers took control of the market and predicts a reversal.
The pattern is easy to trade, with an entry at the candle's close following the hanging man, with stops above the high of the hanging man candle.
Back to top
Candlestick Reversal Pattern – Bullish Engulfing:
Bullish engulfing candles occur repeatedly and can be traded successfully. They provide more opportunities as they occur frequently. Bullish engulfing can happen in any time frame and can be successfully traded by scalpers and swing traders.
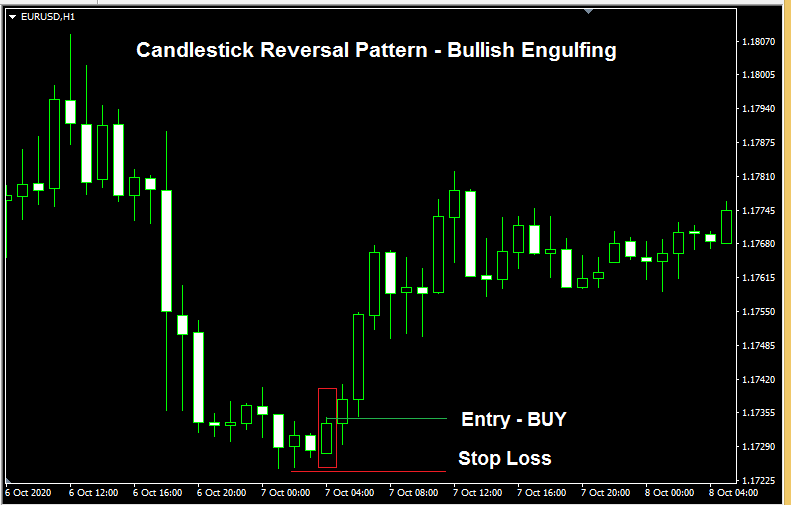
The bullish engulfing candle engulfs the previous sell candle. The engulfing of the last candle in the opposite direction indicates the market sentiment to the trader. The bears are in control in a downtrend, but this engulfing candle opens lower than the previous bear candle and closes higher, completely engulfing it. This provides the trader information that the buyers now have control over the market and anticipates a price reversal to the upside direction.
Buyers can enter the market at the close of the engulfing candle, with stops below the previous swing low.
Back to top
Forex Reversal Candlestick Pattern – Bearish Engulfing:
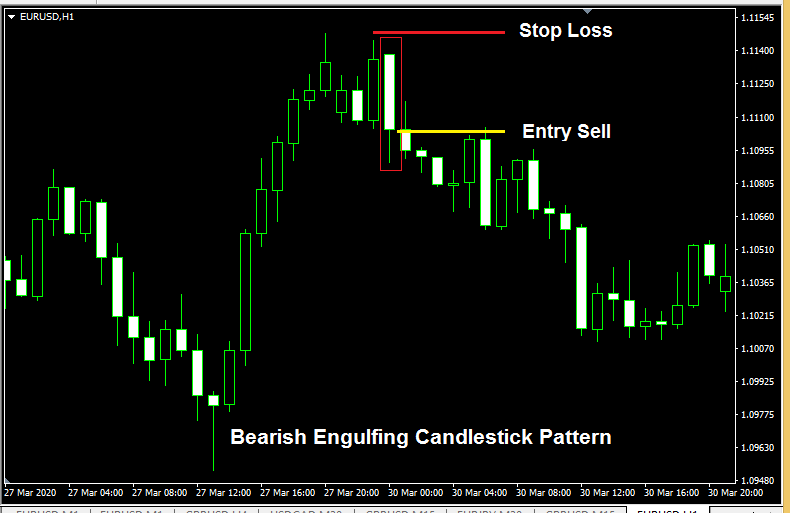
The bearish engulfing pattern is opposite to the bullish engulfing candlestick pattern. In the above picture, the prices were on an uptrend. The uptrend witness a stall in the movement followed by the formation of a bearish engulfing candle. The stalling of the prices and inability to move higher, combined with the formation of a bearish candle engulfing the previous bullish candle, indicates the market direction's impending reversal.
The engulfing candle opened higher than the previous bull candle and closed below it, engulfing it. Traders can visually see the engulfing and enter the markets with a sell position with stops above the last swing high.
Back to top
Candlestick Trend Reversal Pattern – Bearish Harami:
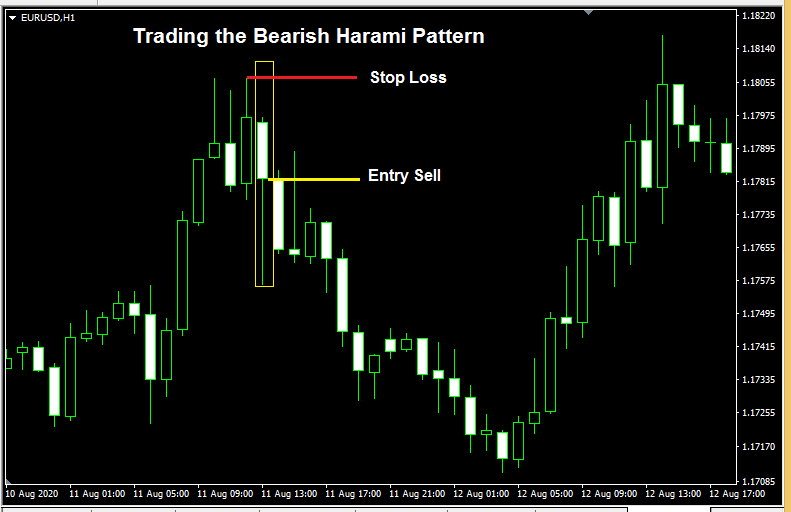
This pattern is also frequent, and the formation indicates a price reversal. In an uptrend, the Harami candle forms as a bear candle. The harami candle opens lower than the previous up candle and also closes higher than it.
The candle can be easily visually identified as it will be shorter than the previous candle of harami candlestick and stays within the high and low of the last candle. The harami candle and the previous candle are always in opposite directions. In a bearish harami pattern, the previous candle should be bullish.
The pattern can be traded by entering the close of the harami candle or the previous candle's open, stopping above the high of a candle before the harami.
If the Harami candle is a Doji, then the pattern is called as Bearish Harami Doji Pattern.
Back to top
Forex Reversal Candlestick Pattern – Bullish Harami:
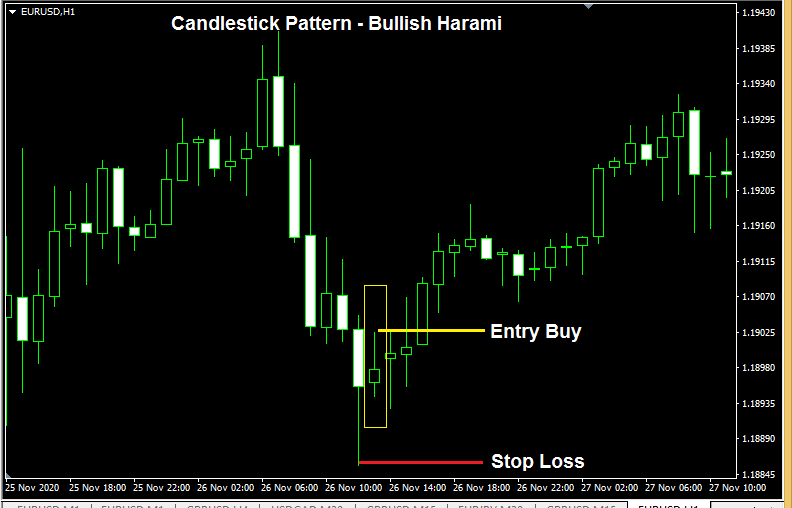
The Bullish Harami pattern is the opposite of the bearish Harami pattern. The pattern occurs during a downtrend and predicts a reversal in the prices to the upwards. The bullish Harami candle opens higher than the previous candle and closes lower than it. If the Harami candle is a Doji, the pattern is called a Bullish Harami Doji pattern.
The currency pair can be bought on the Harami candle's closing, with stops placed below the previous swing low.
Back to top
Candlestick Reversal Pattern – Three White Soldiers:
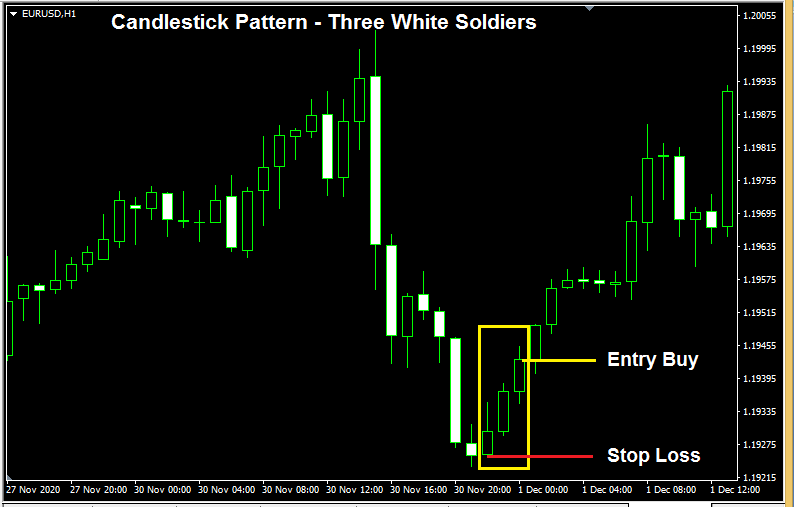
The Three White Soldiers is a bullish candlestick reversal pattern and provides the best opportunity to buy the trading instrument.
The pattern is identified by the formation of three bullish candles in a row. It indicates the buyers' s strength and a possible reversal of market sentiment and a change of trend direction.
At the close of the third bullish candle and stops loss, the entry point is at the low of the first of the three candles.
Back to top
Candlestick Reversal Pattern – Three Black Crows:
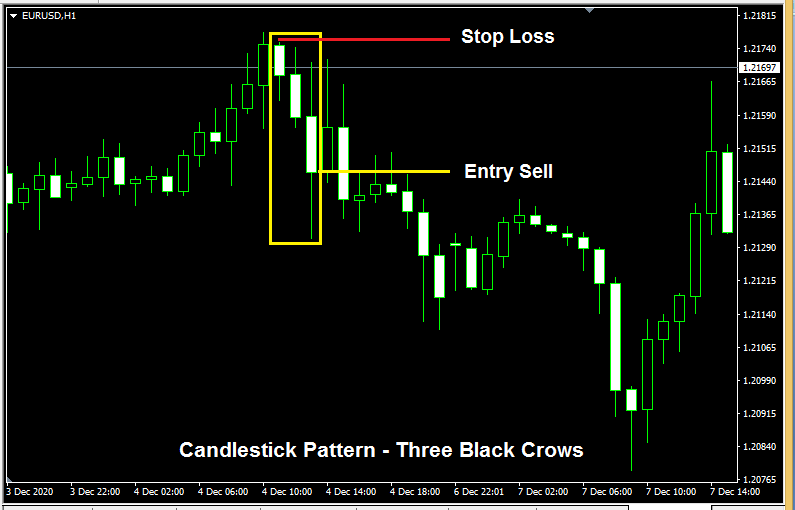
The Three Black Crow pattern is the opposite of the Three White Soldiers pattern. The pattern is visible by the formation of three bearish candles continuously in a row.
The formation of three candles confirms that the sellers have indeed taken over the buyers. Since the sellers have the control, the trader enters the market in a sell direction, anticipating prices to continue lower.
The third candle's close confirms the pattern and serves as an entry point, while the best stop loss points are at the high of the first bear candle of the three crows.
Back to top
Candlestick Reversal Pattern – Morning Star Doji :
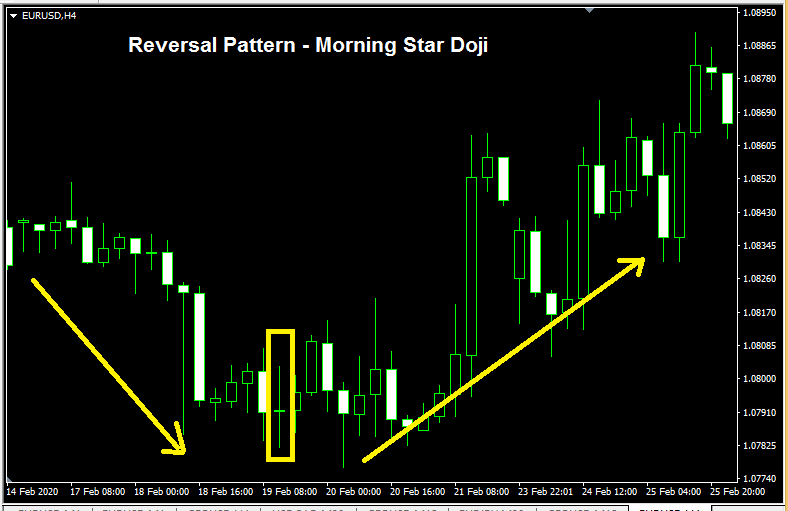
The Morning star Doji pattern is a bullish reversal pattern. The pattern consists of a DOJI candle. The Doji candle can be visually identified by its unique shape representing the " +. "
A Doji candle has the same opening price and closing price. The Doji reflects indecision in the market sentiment.
A Doji candle may form during indecision periods and low volatility, particularly during the weekends or at the closing hours or the opening hours. There will be less liquidity. The Doji formed during these times may not provide the best trading results. It is always better to understand the formation in context during trending markets, as the formation will signify a real moment of indecision while prices are trending.
The Doji candle can be formed in different types and shapes as Long Legged Doji, Gravestone Doji, Dragonfly Doji.
Back to top
Candlestick Reversal Pattern – Evening Star Doji:
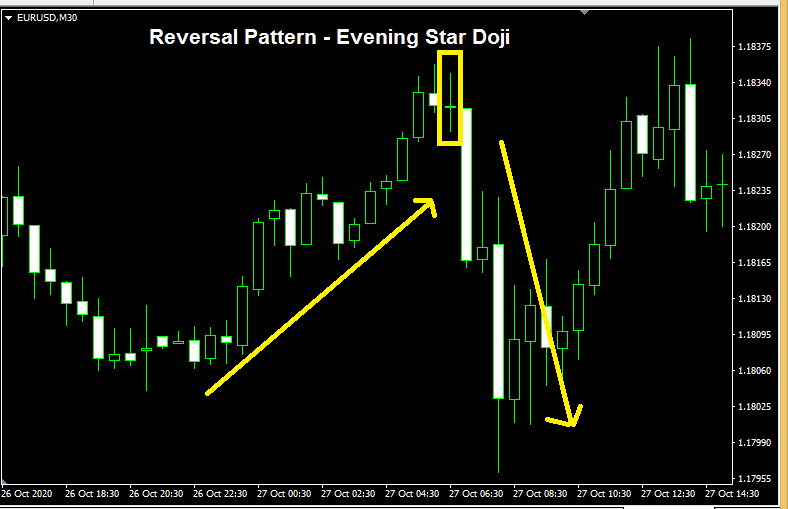
An Evening Star Doji Pattern is the opposite of the Morning Star Doji Pattern. It occurs in an uptrend and signifies the reversal of the trend.
The presence of Doji indicates indecision in the market sentiment; the following candle validates the Doji. The candle following the Doji closes as a downtrend and confirms the market participants' intent to move the prices lower. The traders can use other technical tools at their discretion to confirm the reversal and trade accordingly.
Back to top
Candlestick Reversal Pattern – Morning Star
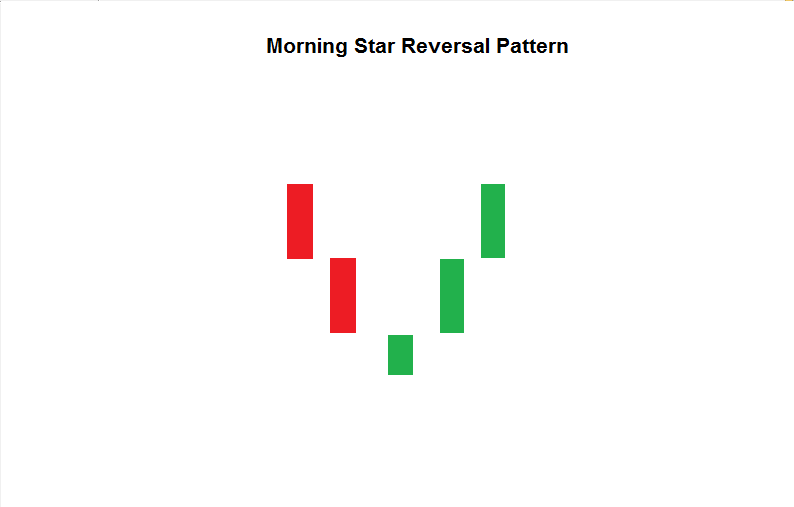
The morning star reversal pattern is similar to the Morning Star Doji Pattern. The Morning star pattern has a regular candle instead of a Doji. The reversal candle is smaller in size and is in the opposite color. The reversal candle in the downtrend is an up candle. The following candles further confirm the formation of a trend reversal.
Back to top
Candlestick Reversal Pattern – Evening Star
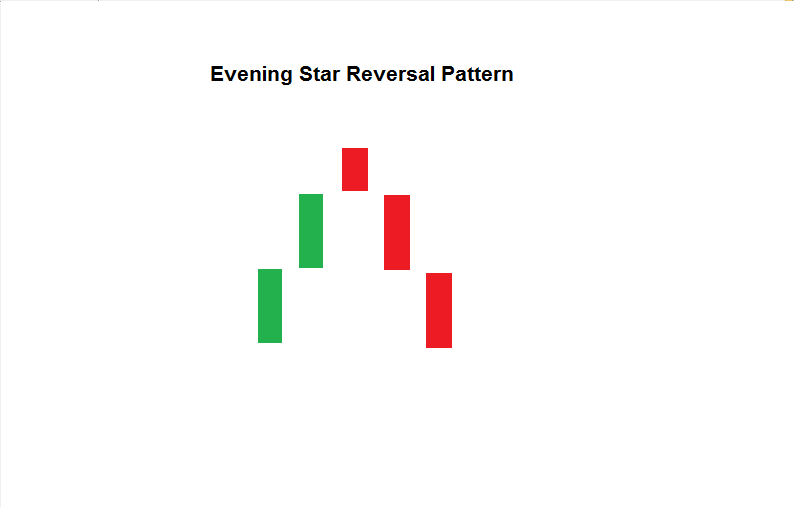
This candlestick reversal pattern is opposite to the Morning Star pattern and is similar to the Evening Star Doji pattern. The pattern can be traded using he same entry and stop loss conditions.
Back to top
Limitations
Candlestick patterns reflect the underlying market sentiment, but they also fail in some instances. The candlestick patterns must be confirmed only if relevant price action follows the pattern for a trader to act upon.
Some of the patterns need to have more than one candle for the pattern to be confirmed. New traders may not have the patience to wait for the patterns to complete and may enter the markets prematurely.
Candlestick pattern is a part of technical analysis and should be treated that way. They should be included with other forms of technical analysis to derive the conclusion. Candlestick patterns have various success levels based on the appearance of the formation within a trend and display a higher success ratio in higher timeframes. However, they can be applied to all chart frames and provide the same meaning wherever they occur.
Back to top
Conclusion
Though candlestick patterns are a technical analysis component, they form an essential tool in the trader's arsenal. It's beyond doubt that the intense study of the candlestick forex reversal patterns will aid every trader in their chart reading skills.
Back to top
eardley-wilmotthoures.blogspot.com
Source: https://www.asiaforexmentor.com/forex-reversal-patterns/
0 Response to "All Forex Continuation and Reversal Patterns"
Post a Comment